🖥️ GitHub Repository | 🐛 Report a Bug
BlinkView is a high-performance log and telemetry viewer for multi-source, high-throughput systems—embedded devices, distributed services, or anything in between.
It aligns and analyzes logs from multiple sources—such as firmware (UART/RTT), CAN bus, Android, or plain TCP/UDP sockets—in a single, time-synchronized timeline. Trace events across processes and devices to understand real system behavior.
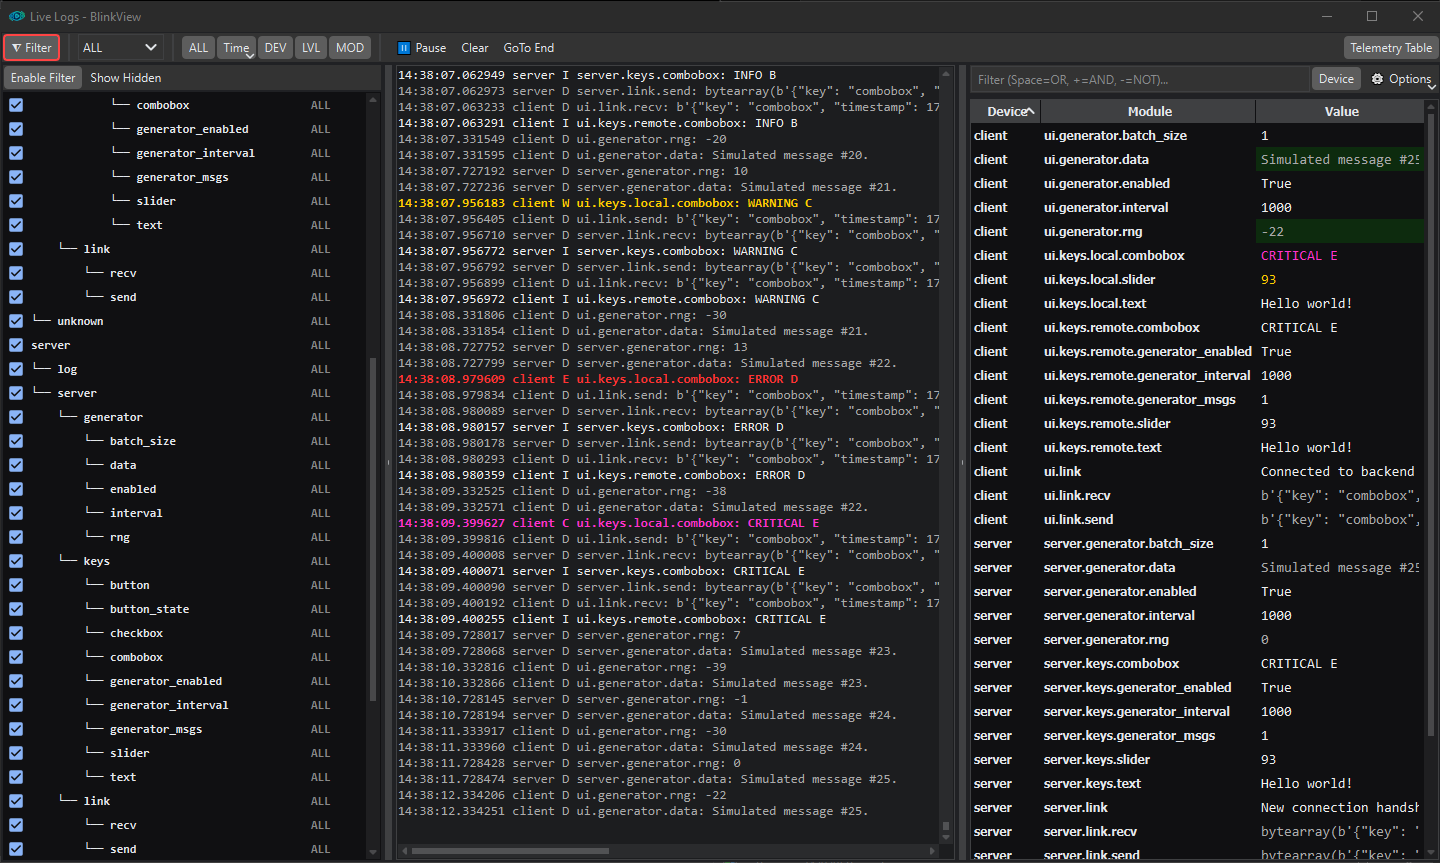
Log Viewer view with one source filtered out, with latest values per module visible in telemetry table.
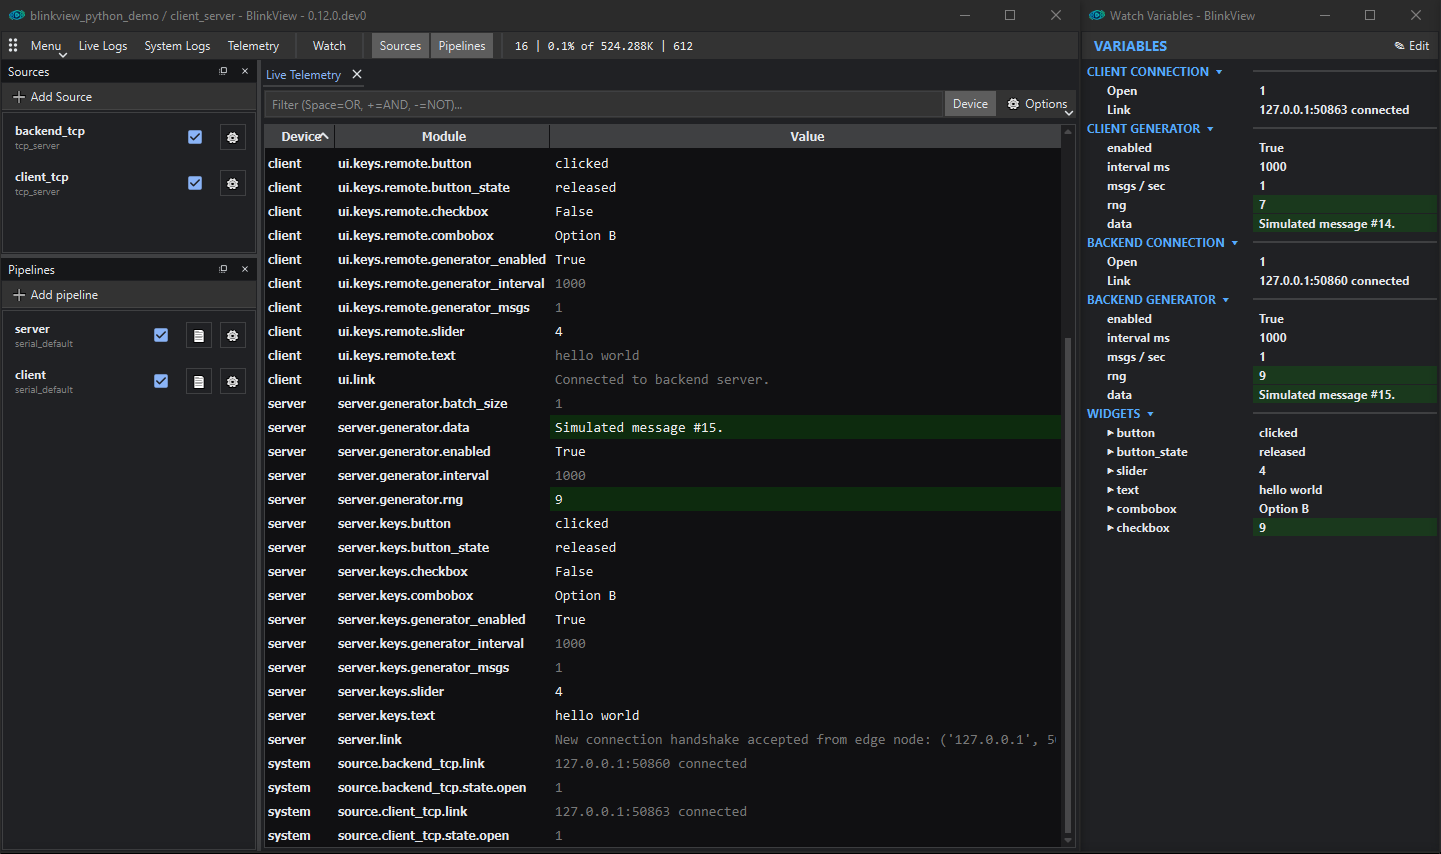
Ingestion from 2 TCP sources, with a custom watch list example. Latest values from all parsed modules visible in telemetry table
In complex hardware/software systems, bugs rarely stay in one layer.
Investigating a failure often means manually aligning timestamps from a
serial terminal, a CAN log, and adb logcat.
BlinkView replaces ad-hoc ‘log-merger’ scripts with a unified environment that handles ingestion, time alignment, and visualization in one place.
BlinkView is a from-scratch rewrite of an earlier single-device tool. Real bugs kept crossing device boundaries, so BlinkView was designed from day one around multiple sources on one synchronized timeline—and has since grown into a general-purpose tool for any high-throughput, multi-source logging problem, hardware or software.
Debugging a command across a system:
BlinkView lets you see all of this in one timeline:
This makes it possible to:
The same approach applies just as well without any hardware in the loop. Debugging a distributed client/server app:
BlinkView lets you see all of this in one timeline:
key=value fields extracted from each log
line for filteringThis makes it possible to:
Want to see BlinkView coordinate a live system right now? Explore this fully configured client-backend simulation package, ready to clone and run:
👉 BlinkView Python Client-Backend Demo Repository
This demo includes a multi-threaded Qt Client and a headless Backend service—no embedded hardware involved, just plain TCP sockets. It lets you click buttons, adjust sliders, and generate synthetic log streams so you can watch BlinkView extract, plot, and align the network telemetry in real time.
BlinkView is installed with uv, which keeps it in its own environment and downloads a suitable Python (3.11+) if you don’t have one.
1. Install uv (skip this if you already have it):
# Windows (PowerShell)
powershell -ExecutionPolicy ByPass -c "irm https://astral.sh/uv/install.ps1 | iex"

# macOS / Linux
curl -LsSf https://astral.sh/uv/install.sh | sh
2. Install BlinkView from PyPI:
uv tool install "blinkview[all]"
blink setup
[all] brings the GUI and every hardware backend.
Narrower extras: pyside6 (GUI only), serial,
can, jlink, hardware (all
three).
blink setup compiles the data-processing kernels once
per version, which takes about a minute. The first blink
does it by itself if you skip it. On a machine without a display, use
blink setup --no-gui.
BlinkView checks for new versions once a day and shows a notice when
one is available. Run blink update upgrade, or use
Check for updates in the app. The update channel
(stable, rc or dev) is picked in
the same dialog or with
blink config --global update.channel dev.
Only needed if you want to change BlinkView itself or run unreleased code:
git clone https://github.com/roland2025/blinkview.git
cd blinkview
uv tool install ".[all]"
blink setup
A source install updates from the git tags in its checkout instead of PyPI. See DEVELOPER.md for the development setup.
# Go to your project directory
cd your/project

# Optional: make this directory a BlinkView project
blink init

# Launch the tool
blink
blink init is optional. It creates a
./.blinkview/ folder, which keeps this project’s settings
with the project instead of in your home directory:
With blink init (project mode) |
Without it (standalone mode) | |
|---|---|---|
| Profiles (sources, parsers, layout) | ./.blinkview/profiles/ (can be committed to Git) |
~/.blinkview/profiles/ |
| Logs | ./logs/ (add to .gitignore) |
~/.blinkview/logs/ |
BlinkView looks for .blinkview/ in the current directory
and its parents, so you can launch blink from any subfolder
of the project.
To store logs somewhere else, set a log directory with
blink config --global log_dir /path/to/logs.
key=value (logfmt) filtering—combine
free-text search with exact-match conditions like
status=ok user_id=42.key=value filtering as the
text viewer.key=value pairs,blink replay on the
CLI) and scrub it exactly like a live one.raw_hex pipeline
to a source to see its bytes as hexdump rows in the log, as they arrived
and next to the parsed lines: for working out a device’s framing or
checking what a parser was given. Stops by itself after a set number of
bytes.blink export writes a
recorded session’s unified log as plain text, filtered by device,
module, or time range—for reading outside the GUI, by hand or from
scripts and AI tools.blink mcp lets
an AI agent such as Claude work with a running BlinkView—send a shell
command to the device and read its reply, read live logs with the log
viewer’s own filters, count lines per module and level to find where the
errors are, check the latest telemetry values and a signal’s history,
read the profile’s configuration and its schema, change the
configuration when you allow it (checked first, with Undo), build watch
lists and open them, reset the MCU, or start a new session. Enabled per
profile by adding an mcp_server pipeline; local connections
only. See Using BlinkView with an AI agent for
the setup.
blinkview.client—reset the device,
wait for a log line, read telemetry—for automated checks against a live
session. See examples/reset_connect_cycles.py,
which resets a board 20 times and reports how long each boot took to
connect.project / profile, so windows from several
running BlinkView instances are easy to tell apart.When several boards share one configuration and differ only in, say, the J-Link serial number or COM port, keep one profile and give each run its own values.
# Declare which config fields can vary (the current value stays as the default)
blink switch rtt --add-param rtt_serial /sources/src_1eb62594/serial_number
blink switch rtt --add-param com_port /sources/src_ab12cd34/port

# Save one parameter set per board (rtt.left.params.json next to the profile)
blink switch rtt --save-params left  --param rtt_serial=51024923 --param com_port=COM7
blink switch rtt --save-params right --param rtt_serial=51099999 --param com_port=COM9
blink switch rtt --show-params

# One BlinkView per board
blink -p rtt --params left
blink -p rtt --params right
--params also accepts a path to any .json
file of name: value pairs, e.g. for machine-specific values
you don’t want in the repo. It can be repeated; later files win.
--param NAME=VALUE overrides a single value for one
run.metadata.json record the values each run actually
used.project / rtt [left]) and is the default session name. A
set can store its own session name
(--save-params left ... --session "Left board");
-s on the command line still wins.rtt.left.gui_state.json), starting from the profile’s
normal layout until it is first saved..blinkview folder is committed to a repo, two
.gitignore rules keep the per-machine files out of it:
*.params.json (parameter sets) and
*.gui_state.json (window layouts).blink ... command line.BlinkView is designed for high throughput and low overhead. In synthetic benchmarks the pipeline handles about 5 million messages per second per thread (roughly 300 MB/s of raw input), and the message reordering thread tops out at 12 million messages per second on the same system. A typical real-world load of 10,000 messages per second barely registers in CPU usage. Ingestion is multi-threaded: each data source runs in its own thread, so a slow or bursty source never blocks the others.
Benchmarks measured on an AMD Ryzen 9 5950X.
graph TD
    %% Source Nodes
    StreamSource[Stream Sources
 UART / RTT / Socket]
    CAN[CAN Source]
    ADB[ADB Source]

    %% Pipeline Subgraphs
    subgraph Stream_Pipe [Stream Pipeline]
        Stream_Raw[Raw File Writer]
        Stream_P[Parser]
        Stream_KV[KV Extractor]
    end

    subgraph CAN_Pipe [CAN Pipeline]
        CAN_Raw[Raw File Writer]
        CAN_P[Parser]
        CAN_KV[KV Extractor]
    end

    subgraph ADB_Pipe [ADB Pipeline]
        ADB_Raw[Raw File Writer]
        ADB_P[Parser]
        ADB_KV[KV Extractor]
    end

    %% Reorder Logic
    Reorder{Reorder Layer
 Time-Delayed Buffer}

    %% Central Hub
    Storage((Central Storage
 Thread-Safe Data Store))

    %% Flow: Sources to Reorder
    StreamSource --> Stream_Raw
    StreamSource --> Stream_P
    Stream_P --> Stream_KV
    Stream_P & Stream_KV --> Reorder

    CAN --> CAN_Raw
    CAN --> CAN_P
    CAN_P --> CAN_KV
    CAN_P & CAN_KV --> Reorder

    ADB --> ADB_Raw
    ADB --> ADB_P
    ADB_P --> ADB_KV
    ADB_P & ADB_KV --> Reorder

    %% Flow: Reorder to Storage
    Reorder -- Ordered Stream --> Storage

    %% Output Nodes (Consumers)
    UWriter[Unified File Writer]
    LogView[Text Log Viewer]
    WatchCmd[Watch / Command List]
    Plotter[Plotter]

    %% Data Flow: Storage to Consumers
    Storage -- Push Stream --> UWriter
    Storage -.->|Poll 10Hz| LogView
    Storage -.->|Poll 10Hz| WatchCmd
    Storage -.->|Poll Variable| Plotter

    %% B&W Styling
    classDef bw fill:#fff,stroke:#000,stroke-width:2px,color:#000
    class StreamSource,CAN,ADB,Stream_P,CAN_P,ADB_P,Stream_KV,CAN_KV,ADB_KV,Stream_Raw,CAN_Raw,ADB_Raw,Reorder,Storage,LogView,WatchCmd,Plotter,UWriter bw
    style Stream_Pipe fill:none,stroke:#000,stroke-dasharray: 5 5
    style CAN_Pipe fill:none,stroke:#000,stroke-dasharray: 5 5
    style ADB_Pipe fill:none,stroke:#000,stroke-dasharray: 5 5
BlinkView is named after the first embedded program everyone writes:
while (1) {
    toggle_led();
}
The blink is the first signal that your system is alive. BlinkView helps you see everything that follows.
License: Mozilla Public License 2.0 (MPL-2.0)